Using the Job Log Viewer for Performance |
||
|---|---|---|
|
Before we begin, you should be aware of a few things that will impact the use of the Job Log viewer. First, if you have enabled Extended Dynamic in your ODBC data source, the AS/400 will package any new queries. If a query is packaged, no optimization messages are shown in the AS/400 job log. Therefore, it is recommended that you set up a data source that does not use packaging so that your queries are optimized each time they are changed. In this manner, you will be able to review optimization messages. I always have several data sources pointing to my target AS/400’s, one optimized for using packages that I use for producing reports and one with extended dynamic disabled that I use when doing performance verification. Steps for verifying performance informationLog into SQLThing with a data source that is not using Extended Dynamic and open a file of statements or create an instance of a blank editor window. Next, press the Eye icon, (this toggles Debug Mode on your AS/400 using the STRDBG command and causes optimization messages to be written to the AS/400 job log). When the eye icon is depresses, STRDBG is ON with the option UPDPROD, (update production files), set to *YES. When the icon is not depressed, STRDBG is toggled off.
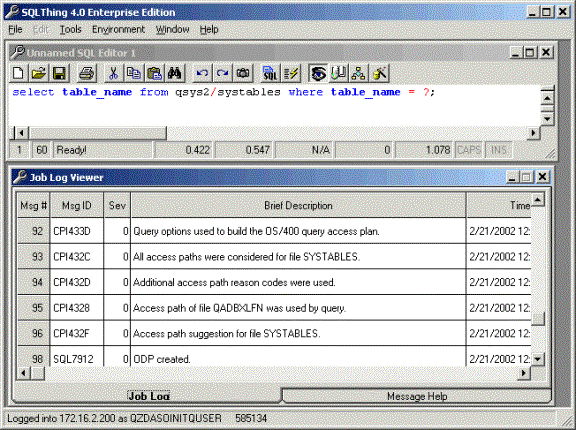
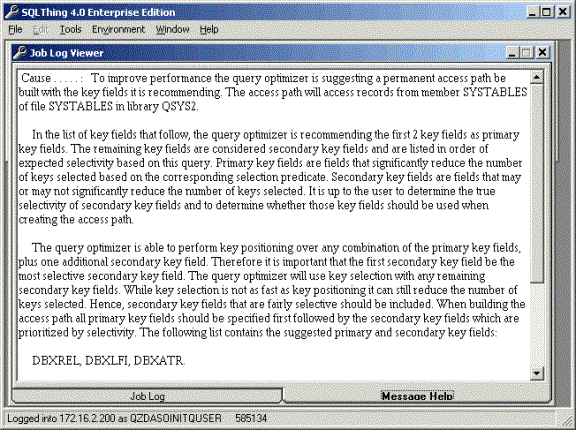
Now, press the Book with CD icon, (this turns on the Job Log viewer), or select the Environment Menu and then click the Job Log Viewer menu option. This will make you SQLThing environment similar to the screen shown in Figure 3‑13 . Arrange the editor windows and job log window for comfortable viewing and begin entering your statement into the editor window. Once the statement is entered, press the Execute icon to cause the statement to run. Any messages added to the AS/400 job log will be displayed in the Job Log window. If you want more details about a job log message, double click on the message or select it and press the Message Details tab. This will cause SQLThing to get all of the details of the message from the AS/400 and return them to your PC. The next screen shot shows the details of a message.
SQL performance is an iterative process. If you pay attention to performance issues at the beginning of a project, the end result will be a more scalable and robust project. For more information on query optimization and performance verification, see www.sqlthing.com or Howard F. Arner, Jr’s book iSeries and AS/400 SQL at Work. |
||