Grouping, Sorting and Totaling |
||
|---|---|---|
|
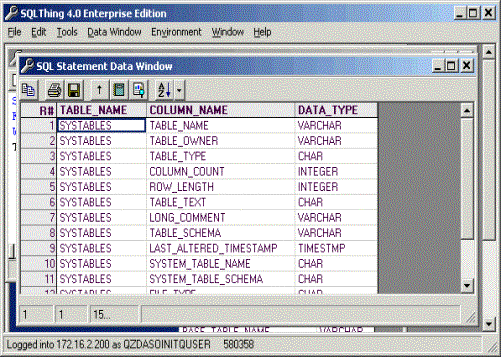
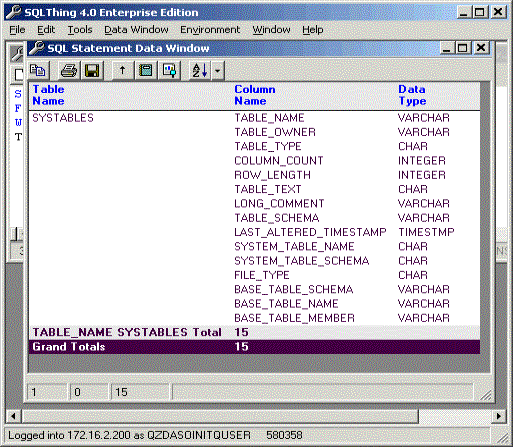
SELECT TABLE_NAME, COLUMN_NAME, DATA_TYPE
	FROM QSYS2.SYSCOLUMNS
	WHERE TABLE_NAME='SYSTABLES' AND
	TABLE_SCHEMA='QSYS2';
Once this statement executes, you should see a data window like this one:
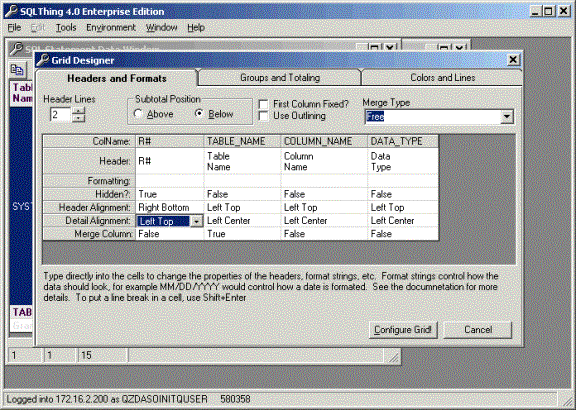
Press the Grid Designer button, (looks like a graph on a piece of paper), to access the Grid Designer. The Grid Designer gives you control over the look of the data window, subtotaling, grouping and more. Here is an example of the grid designer screen:
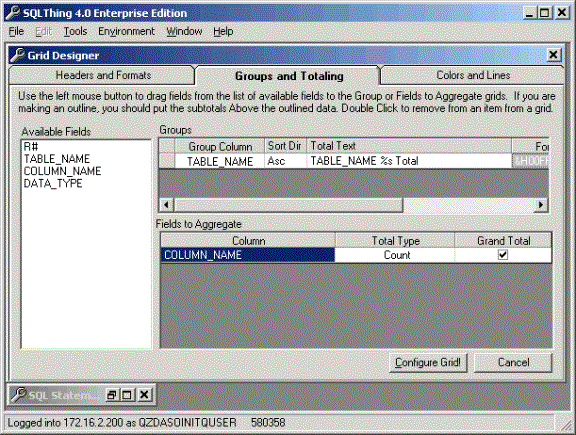
The Headers and Formats tab allows you to change many aspects of the grids display. You can increase the number of header lines, change the headings of columns, hide columns and control the formatting of data. Make the R# field hidden and change headers of your report. Also, set the Merge Column property of the TABLE_NAME column to true and set the merge type to free. Finally, uncheck the First Column Fixed property. Next, select the Groups and Totaling tab. This tab allows you to control how SQLThing aggregates data and how it outlines or groups data. Click on the TABLE_NAME column to highlight it an then use the left mouse button to drag the TABLE_NAME column into the groups.
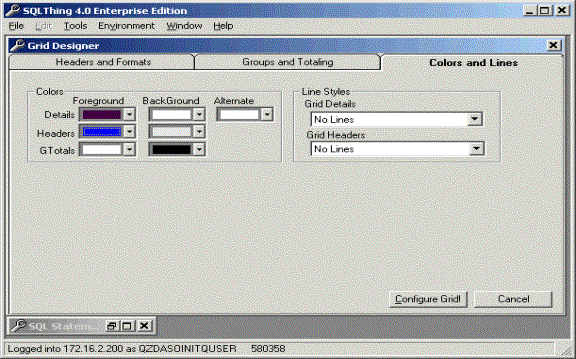
Note that you can scroll the Groups grid to the right to reveal the colors that the group will use when writing subtotal lines. These colors are configurable for each group you add to a grid report. Next, click on the COLUMN_NAME field to highlight it and then drag the field to the “Fields to Aggregate” grid. Click in the total type box to select Count as the aggregate to perform. Now, Click on the Colors and Lines tab and change the default colors and lines that the grid window uses. I suggest turning off lines in both the headers and details if you intend to print your grid report.
Press the Configure Grid button to close the window and write your settings back to the grid and format your report. If you set the options like the ones in the pictures above, your grid report should look something like the screen shown below. That’s all there is to making a report. To print a grid report, just click on the printer icon and follow the directions. In addition to printing, you can persist the grid report to an XML file. Once a report is persisted, you can distribute the grid report to users of the SQLThing Viewer utility. The SQLThing viewer is an easy to use program that allows end users to run Grid Report and SQLThing Reports.
Pressing the disk icon allows you to persist the formatting information and SQL statement used to create this grid. Persisted grids can be used by the SQLThing End User Tool to deliver interactive reports to your end users. |
||